


The Eight Sleep Pod Heart Rate and Heart Rate Variability Accuracy
By
May 25, 2023
At Eight Sleep, we strive to provide our members with not only an optimal sleep experience, but also highly accurate biometric data during sleep. Our sensing technology, embedded in the Pod’s Active Grid Cover, is designed to monitor a variety of biometrics without any wearable and for up to two people on the same bed. This design presents a set of technical challenges, but it is also a better experience for our members who don’t have to wear a device to bed in order to monitor their sleep and health.
Today, we are launching a key update to our heart rate variability (HRV) algorithm.
The performance of both the heart rate (HR) and HRV algorithms were validated against gold standard electrocardiogram (ECG) on more than 474 nights of data from 163 unique subjects, comprising over 208,600 minutes of sleep.
 Figure 1. Correlation between the Eight Sleep Pod HR and the gold standard ECG HR (r2 = 0.99). Each dot represents a single night of sleep (n=133). The black dashed line represents a correlation value of 1.0 or the best-fit line (1:1 match between Pod and ECG HR).
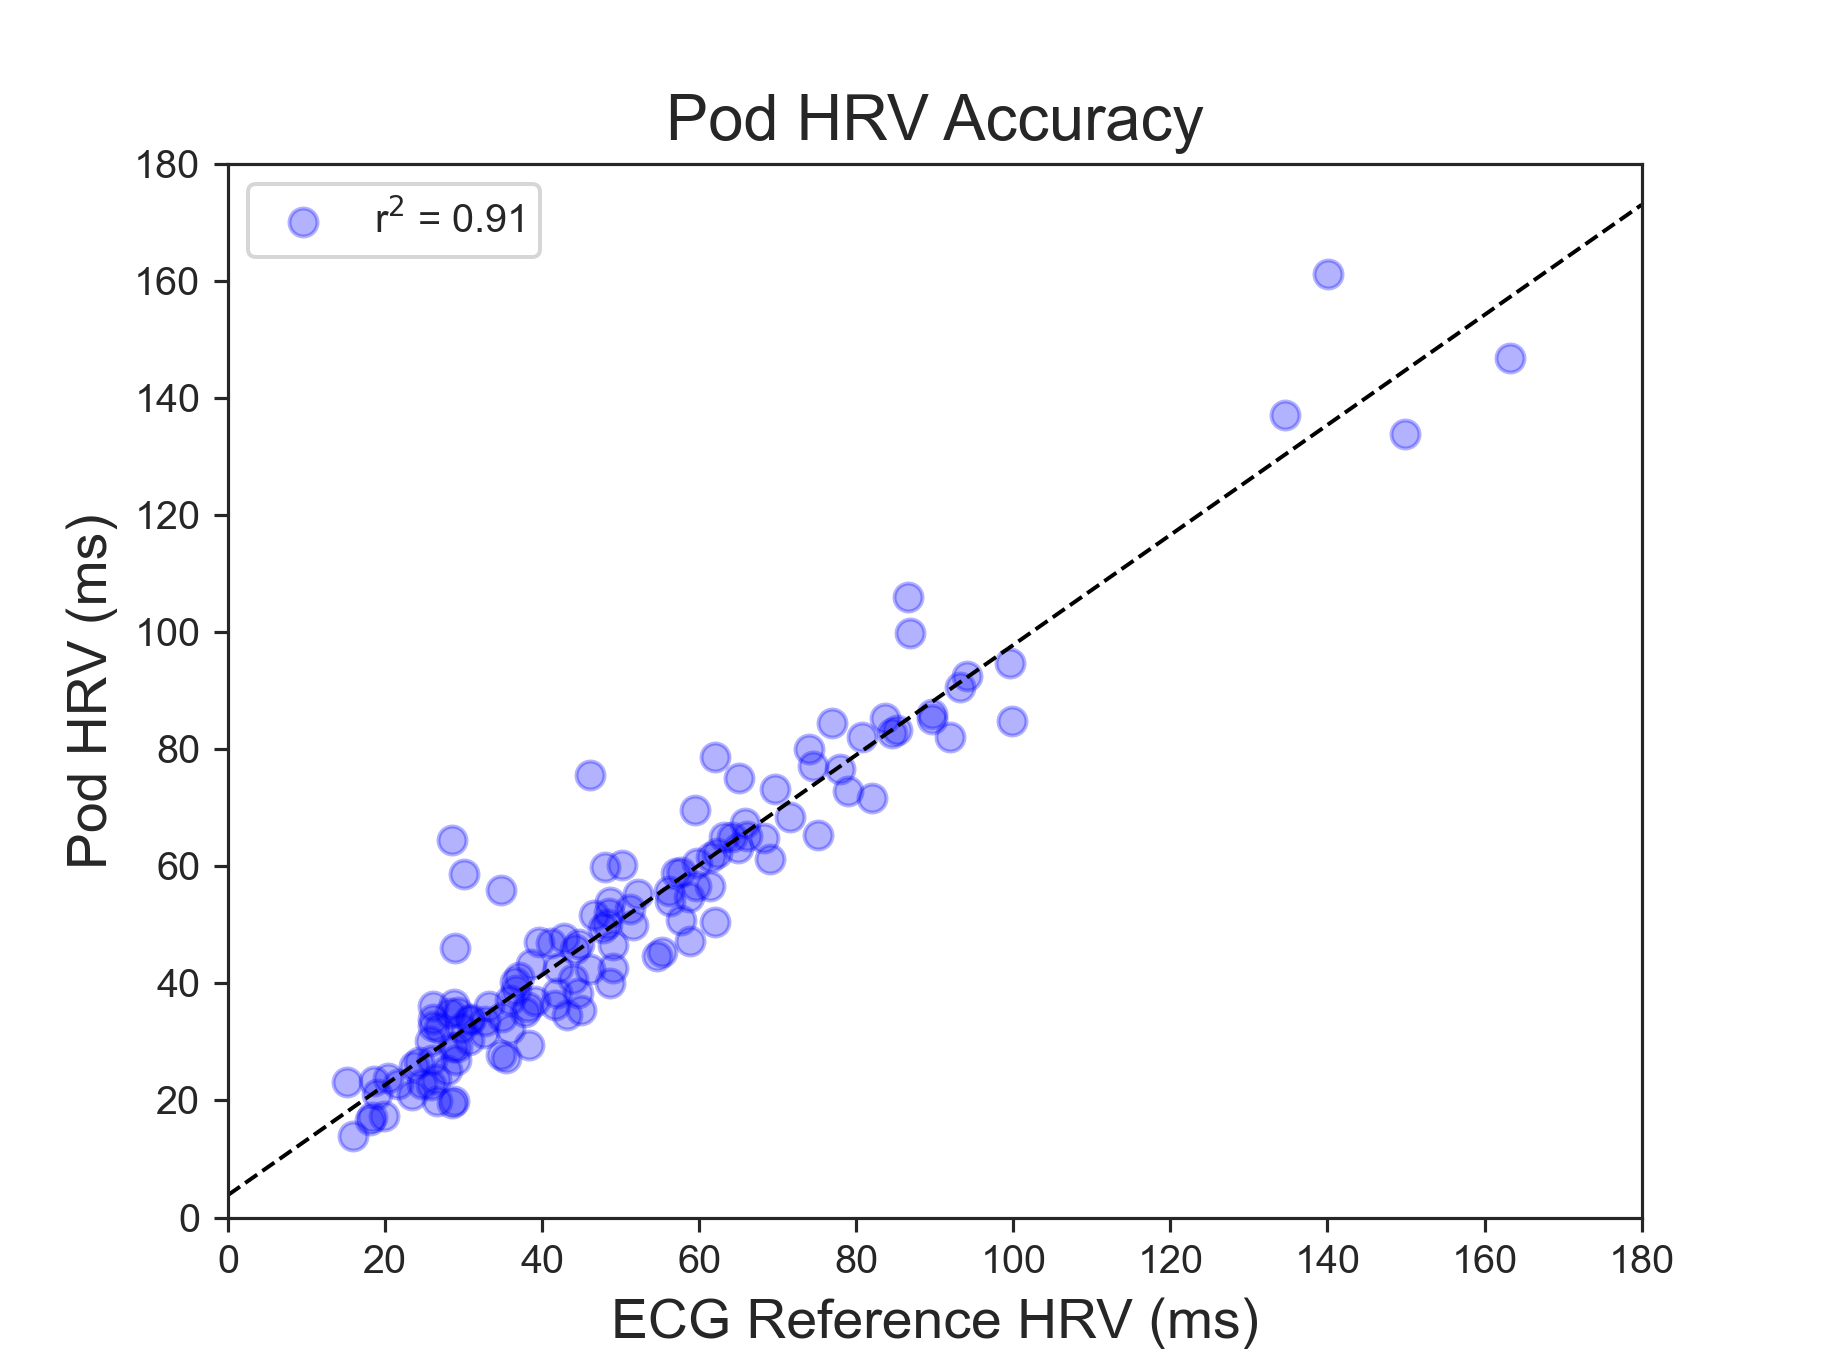 Figure 2. Correlation between the Eight Sleep Pod HRV and the gold standard ECG HRV (r2 = 0.91) for Pod 3 data. Each dot represents a single night of sleep (n=133). The black dashed line represents a correlation value of 1.0 or the best-fit line (1:1 match between Pod and ECG HRV).
The Pod’s Sleeping Heart Rate Tracking is 99% Accurate
Key Statistics: Eight Sleep’s sleeping HR algorithm has a mean absolute error of less than one beat per minute (bpm), a mean absolute percent error of 1.5%, and mean error of less than 0.1 bpm. One of the best ways to visualize this excellent accuracy is to look at the correlation value (i.e. correlation coefficient) between the ECG HR and the Pod HR. A correlation value of zero means there is no relationship between the two devices, and a correlation value of 1.0 is the highest correlation value and means that the HR values from the Pod perfectly match that of the ECG. The correlation value between the Pod HR and ECG HR is 0.996 (r2 = 0.99) – a near perfect match (Fig. 1).
Figure 1. Correlation between the Eight Sleep Pod HR and the gold standard ECG HR (r2 = 0.99). Each dot represents a single night of sleep (n=133). The black dashed line represents a correlation value of 1.0 or the best-fit line (1:1 match between Pod and ECG HR).
Sleeping Heart Rate Variability Highly Strongly with Gold Standard ECG
About HRV: There are several ways to calculate HRV. At Eight Sleep we present your HRV values as the Root Mean Square of Successive Differences (RMSSD) between heartbeats. HRV gives you a measurement of the variability in milliseconds (ms) of your consecutive heartbeat intervals. Generally, a higher HRV is considered healthier, and changes in your HRV can indicate how well-rested you are, both physically and mentally. Note that there is a wide range in “normal HRV,” so we recommend looking at your own HRV trends across weeks and months to evaluate changes in your sleep and recovery. Key Statistics: Eight Sleep’s new HRV algorithm has a mean error of 0.782 ms, a mean absolute error of 5.7 ms, and correlation value of r = 0.953 (r2 = 0.91) compared to gold standard ECG (see Fig. 2).
Figure 2. Correlation between the Eight Sleep Pod HRV and the gold standard ECG HRV (r2 = 0.91) for Pod 3 data. Each dot represents a single night of sleep (n=133). The black dashed line represents a correlation value of 1.0 or the best-fit line (1:1 match between Pod and ECG HRV).